Quick Take: I set out to visualize neural network internals to gain real understanding, but discovered that even a relatively tiny 111k parameter model is still too complex to meaningfully comprehend without extensive systematic study. The interactive visualization tool I created provides some glimpses into model behavior, but mostly reinforced how much work would be needed to actually learn something concrete.
The Goal: Visualizing Neural Network Internals Link to heading
With increased use of AI both at work and personally, I wanted to try and create a visualization of how the internals of a small model worked, the idea being that you could zoom into the network and see the values and trace the lines. All existing visualizations I’d seen were just illustrated or static, not full/real or interactive.
My learning goal was to build something that would let me gain basic understanding and then tweak parts of the data or model to see how changes manifested within the network. I wanted to move from theoretical knowledge to hands-on intuitive understanding through direct manipulation. Obviously this wouldn’t be practical on a large model.
Building the Foundation: Training a 111k Parameter Model Link to heading
I realized I needed to build the concrete model infrastructure first before I could do the tweaking and manipulation experiments I was envisioning. With some poking around I decided to use the MNIST dataset - the 28x28 input seemed manageable to visualize and 10 output buckets were simple enough to understand.
First thing I did was work with Claude to train a model on the data that would fit my goal. We created a model that has ~111k parameters (current LLMs have 100’s of billions) and achieves 98+% accuracy. At a high level the model does the following:
- Takes in 28x28 grayscale values
- Runs 32 filters over those values and emits 14x14 values
- Runs 64 filters over those values and emits 7x7 values
- Runs 128 filters over those values and emits 7x7 values
- Calculates the probability of the input being each digit from 0-9
Or more simply 28×28×1 → 14×14×32 → 7×7×64 → 7×7×128 → 10 probabilities
There are tons of resources online if you want to learn more about MNIST models so I won’t go into much more detail here.
First Attempt: Graph Visualization Reality Check Link to heading
I was able to achieve 98+% accuracy, so the foundation was established. Now it was time to focus on the real challenge, the visualization itself.
At first I was trying to get Claude to draw the model as a graph with the links and values so they could be examined. This sort of worked, but the model was still too big to be practical for what I was originally looking for. A reality check moment that even my ‘small’ 111k parameter model was going to be too much for the introductory learning setup I had in mind. But while working on this part I ran into another issue, how to make it easy to get input for using it in the first place. I stepped back and decided to tackle the input problem first.
Course Correction: Interactive Web Interface Link to heading
I switched to focusing on allowing a digit to be drawn on screen and putting out the prediction along with distribution.
This actually came together very quickly with help from Claude. I still wanted to capture some of the educational value from my original vision. I worked with Claude to explore potential insights, similar to our past writing collaborations.
Exploring Model Behavior: When 2s Look Like 5s Link to heading
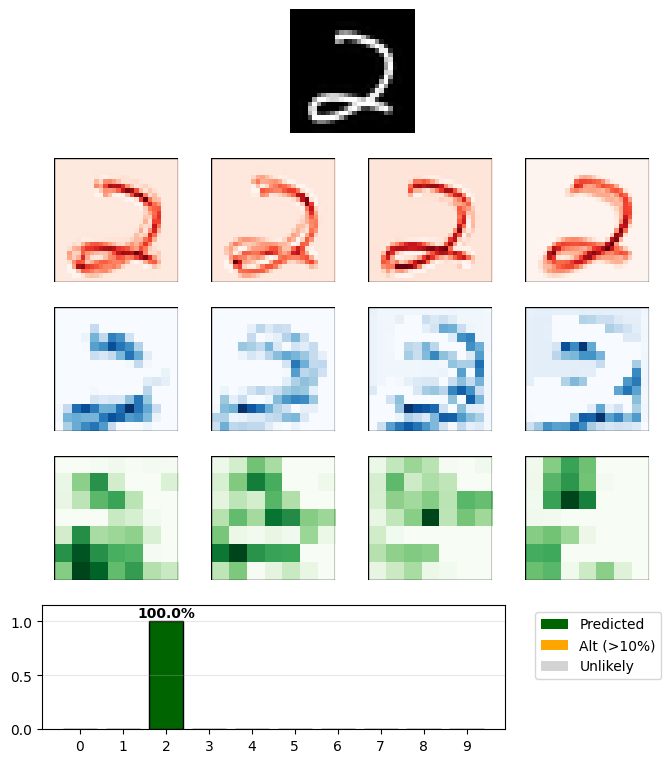
I still wanted to capture some of the educational value I was hoping for when I started the project, so I worked through some additional ideas and now you can see the visualization of how different filters on different layers are behaving. For example, drawing a 2 shows these patterns:
But drawing a 2 like on a digital clock causes the model to predict it’s a 5:
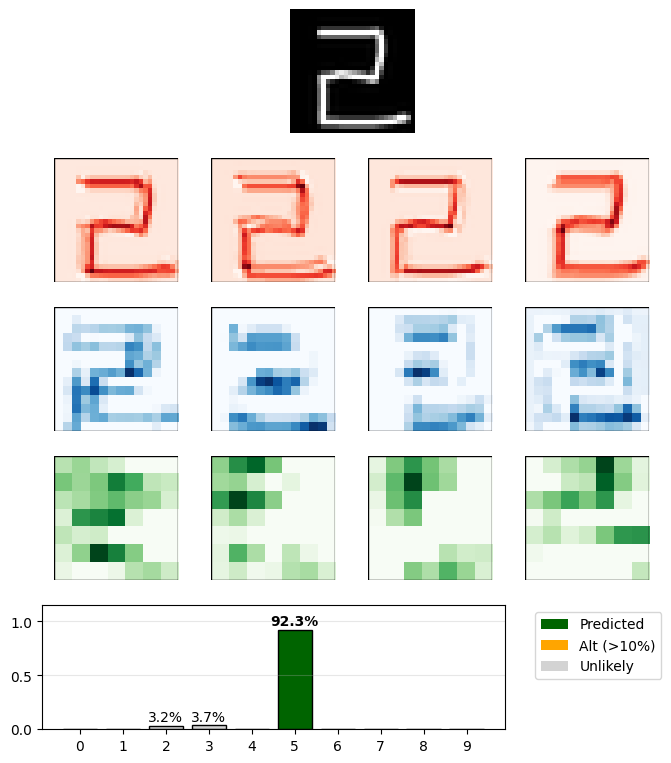
This isn’t very surprising since the training data was hand written digits and very few people write their 2s like you see them on a digital clock, and the shape most closely resembles a 5.
Since the model can only output answers from 0-9 if you give it random lines it’ll still give you a confident guess.
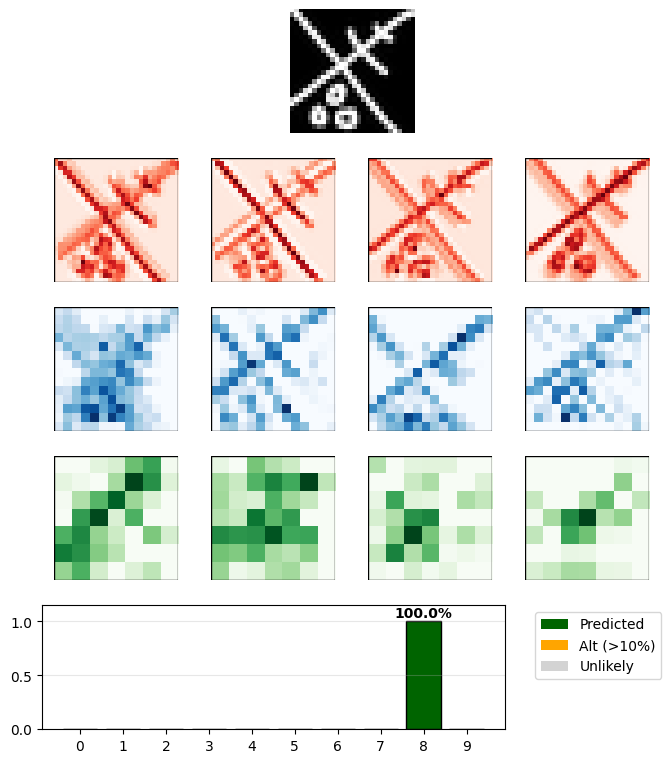
Doesn’t look like an 8 to me but I guess that is the best guess. It would be an interesting extension to provide ’not a number’ training data to handle invalid inputs.
Reflections: Understanding the Limits Link to heading
Overall it was a fun project, the longest part was actually getting the visualizations to look good. Claude was competent at core matplotlib functionality like creating visualizations, handling data, and setting up plots, but terrible at layout and spacing details. When I asked for spacing adjustments, Claude would either make no noticeable changes or do the opposite of what I requested.
During this collaboration, Claude confidently introduced incorrect mental models about layers detecting specific features. When I questioned this later, Claude ran tests, realized it was wrong and backtracked, but the incorrect ideas kept popping up even after correction attempts. Claude was overgeneralizing educational CNN explanations without verifying they applied to this specific model.
I thought 111k parameters would be small enough to comprehend, but even that proved too complex for meaningful human understanding. The project reinforced that we don’t really understand how neural networks truly work, and that genuine understanding would require extensive systematic study rather than just building a visualization tool.
All the code is available at https://github.com/jjshanks/mnist_classifier